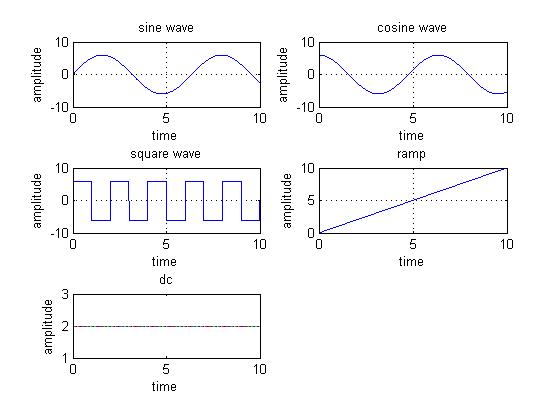
MATLAB code with comments to generate common time signals
Hello, friends here I am providing MATLAB code for generating different common continuous time signals such as sine wave, cosine wave, square wave, ramp wave and dc signal, with the comments for each code to learn what each code stands for. So let's go...!!
Here is the M-code with comments:
This will be your input to MATLAB window:
clc %clear screen
a=6; %defined amplitude
t=0:.01:10; %time interval=(initial:diff:final)
f=9; %defined frequency
y1=a*sind(2*pi*f*t); %formula of sine function
subplot(3,2,1) %plotting at first place out
of 6
plot(t,y1) %continues signal of sine wave
xlabel('time') %defining X-axis
ylabel('amplitude') %defining Y-axis
title('sine wave') %Title of sine Graph
grid on
y2=a*cosd(2*pi*f*t); %formula of cosine function
subplot(3,2,2) %plotting at second place
out of 6
plot(t,y2) %continues signal of
cosine wave
xlabel('time') %defining X-axis
ylabel('amplitude') %defining Y-axis
title('cosine wave') %Title of cosine Graph
grid on
f1=0.5; %defined frequency
y3=a*square(2*pi*f1*t); %formula of Square wave
subplot(3,2,3) %plotting at third place out of 6
plot(t,y3) %continues signal of
square
xlabel('time') %defining X-axis
ylabel('amplitude') %defining Y-axis
title('square wave') %Title of square Graph
grid on
Y4=t; %formula of ramp
wave
subplot(3,2,4) %plotting at fourth place
out of 6
plot(t,t) %continues signal of
RAMP
xlabel('time') %defining X-axis
ylabel('amplitude') %defining Y-axis
title('ramp') %Title of ramp Graph
grid on
y5=2; %formula of dc
signal
subplot(3,2,5) %plotting at fifth place out
of 6
plot(t,y5) %DC signal
xlabel('time') %defining X-axis
ylabel('amplitude') %defining Y-axis
title('dc') %Title of DC Graph
Your output will look like this each graph shown here.


Post a Comment